Experimental 3D viewers in Glue
Important
The functionality described on this page is highly experimental and is not feature-complete. If you do try it out, let us know if you have any feedback, or are interested in helping develop it further!
A plugin with experimental 3D viewers for Glue, powered by VisPy, is now available. To install this plugin, you will first need to make sure that the VisPy package is installed.
If you are using Anaconda to manage your Python distribution, you can install or update VisPy and the 3D plugin using:
conda install -c conda-forge glue-vispy-viewers
If you don’t use Anaconda, you can install the plugin using:
pip install glue-vispy-viewers
Note that this functionality requires Glue v0.7.3 or later.
If you are interested in recording animations from the 3D viewers, you will also need to install the imageio package:
pip install imageio
With the plugin installed, you will now have access to three new data viewers in Glue:
- 3D scatter viewer
- 3D volume rendering viewer
- 3D isosurface viewer
Please read on to understand the current functionality and limitations of each viewer. If you are interested in getting involved in implementing some of the missing functionality or fixing known issues, please join the glue-viz-dev mailing list and let us know!
Common options for all viewers
All 3D viewers share a similar panel in the bottom left:
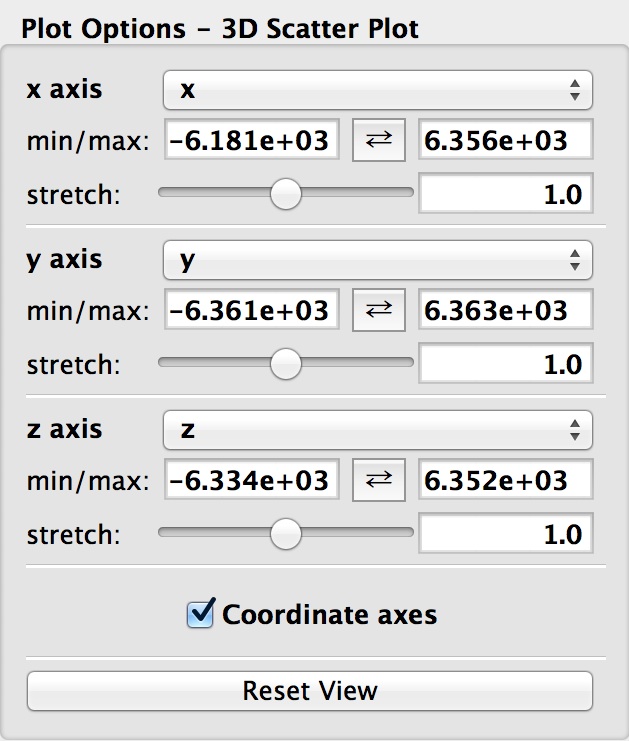
In addition, all viewers will show a white rectangular 3D box, which by default is a cube. The edges of the cube correspond to the min/max values in the options panel above. If these values are changed, the data is renormalized inside the cube, but the white cube stays the same. It is also possible to instead stretch the cube into a rectangular box with a different size in each dimension, using the sliders. This can be useful in the case of a volume rendering, if the number of pixels is very different along different axes.
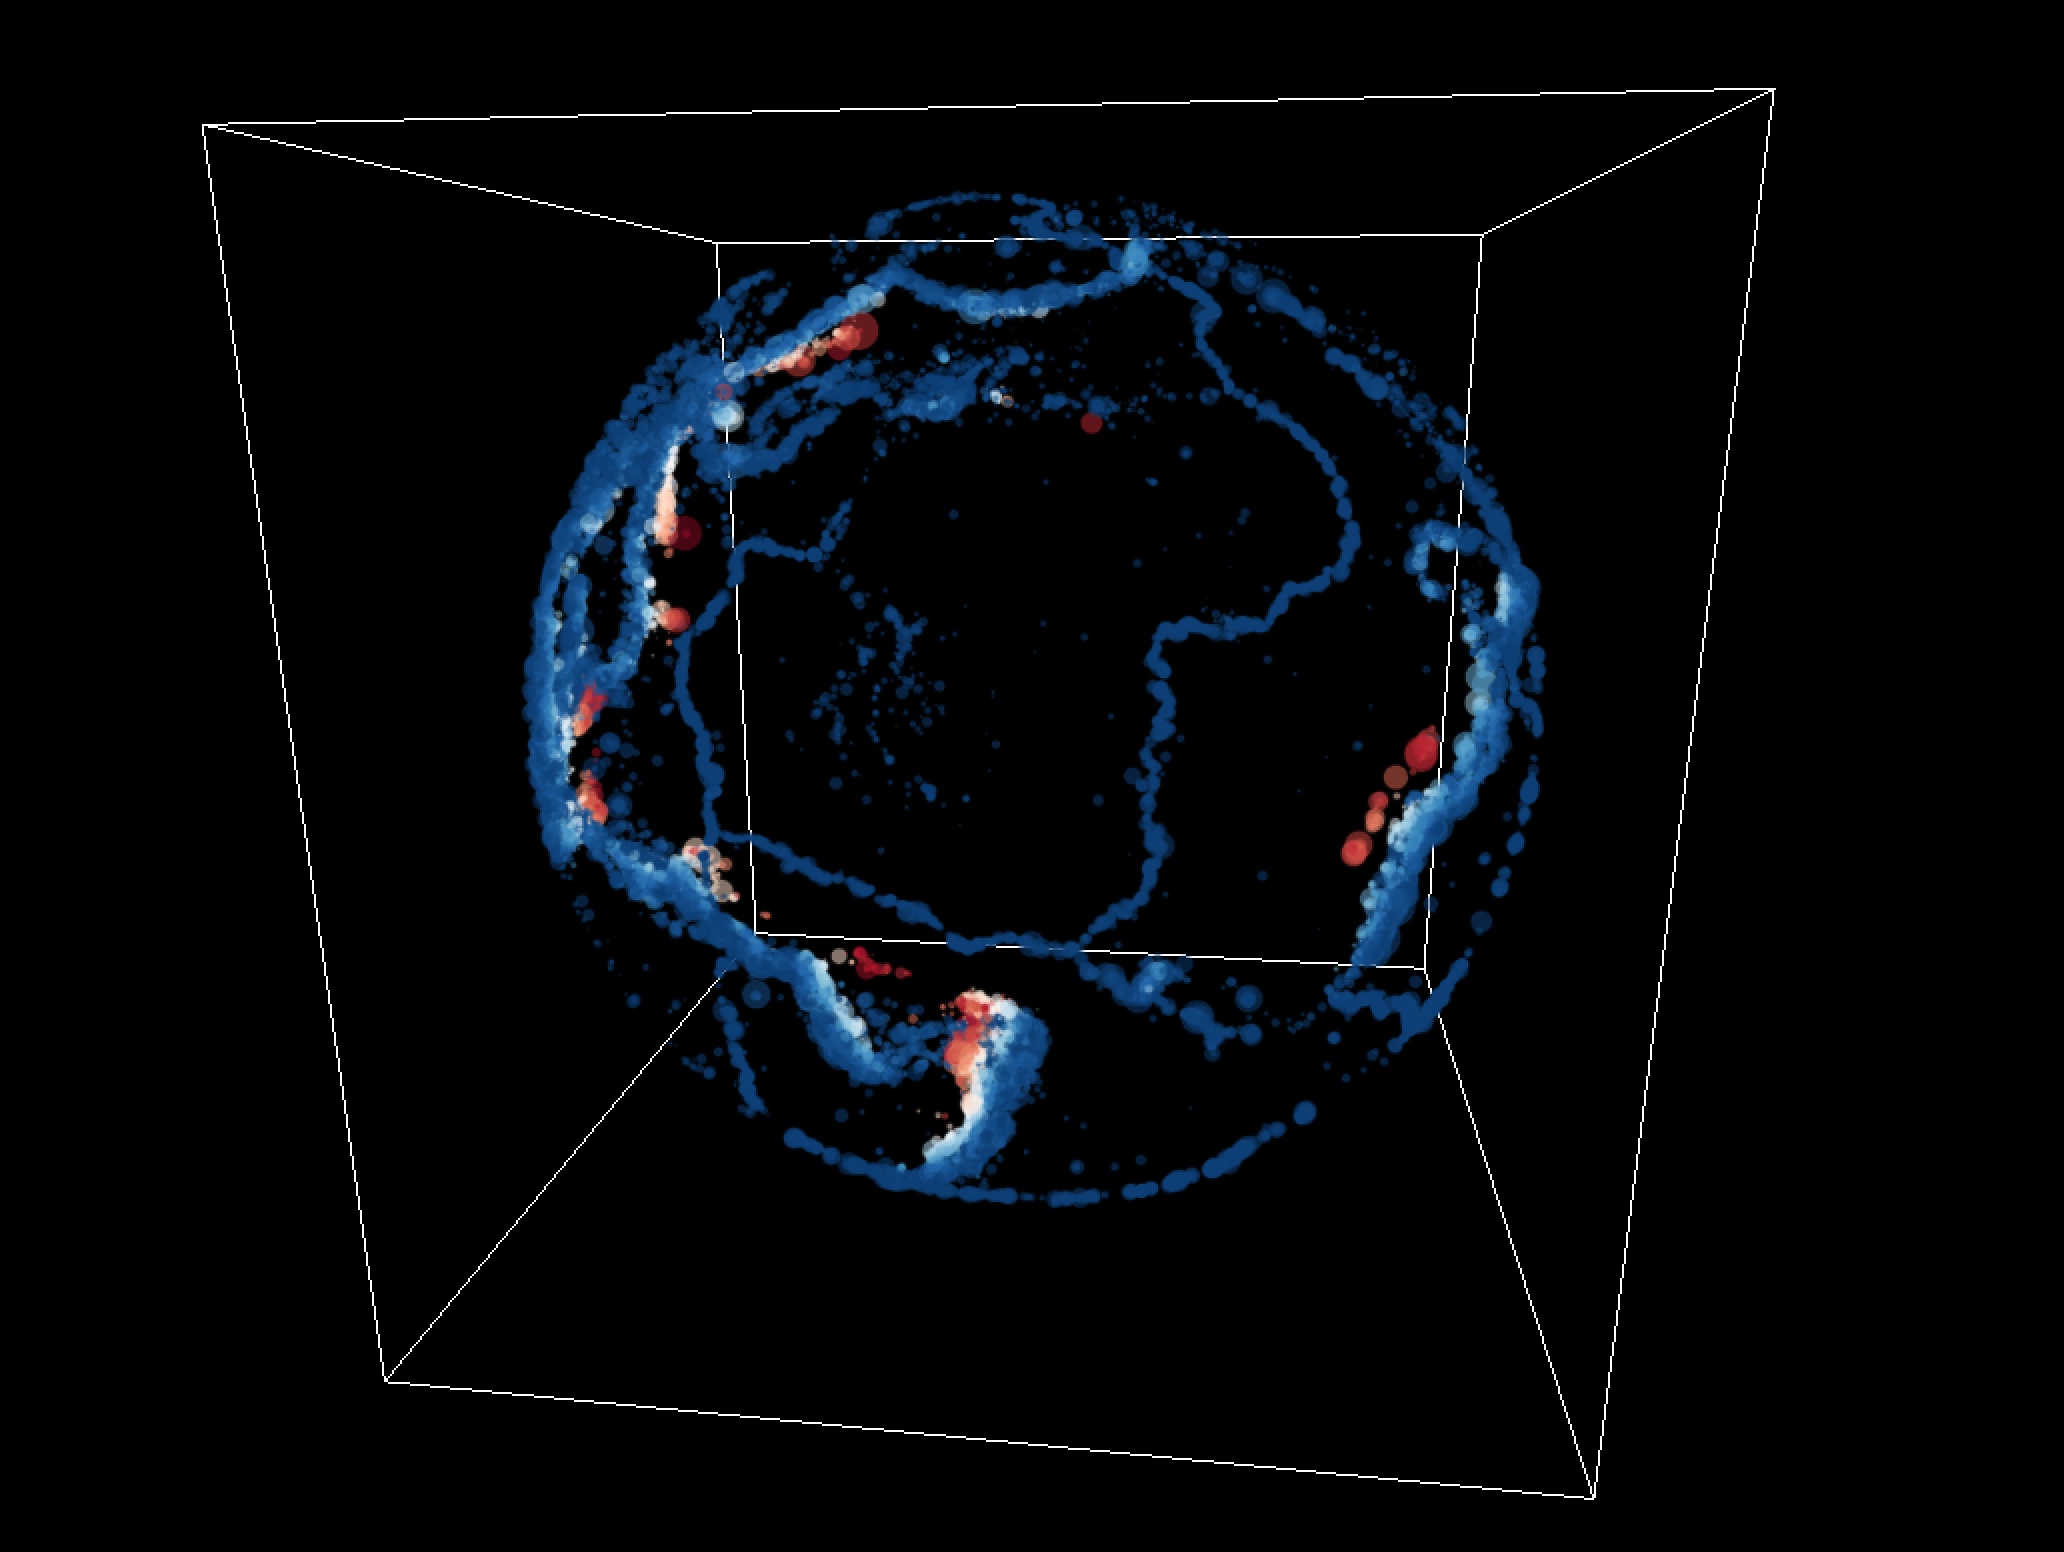
3D Scatter Plot Viewer
The 3D scatter plot viewer is the most feature-complete of the viewers at the moment. It is currently able to:
- Display markers based on any 3 data components
- Highlight subsets made in other viewers
- Control the visual appearance of both data and subsets
- Color code markers using any component
- Set the size of markers to depend on any component
- Scale the absolute size and the transparency of markers in each layer using sliders
The following visualization shows a 3D scatter plot with the location of earthquakes around the globe, color coded by depth and with the size set by the magnitude of the earthquake:
At the moment this viewer is not able to show multiple datasets (just one dataset with subsets), but this will be added shortly.
3D Volume Rendering Viewer
The 3D volume rendering is currently able to show only 3D datasets (not e.g. 4D cubes sliced along one dimension). The viewer is able to also highlight subsets made in other viewers:
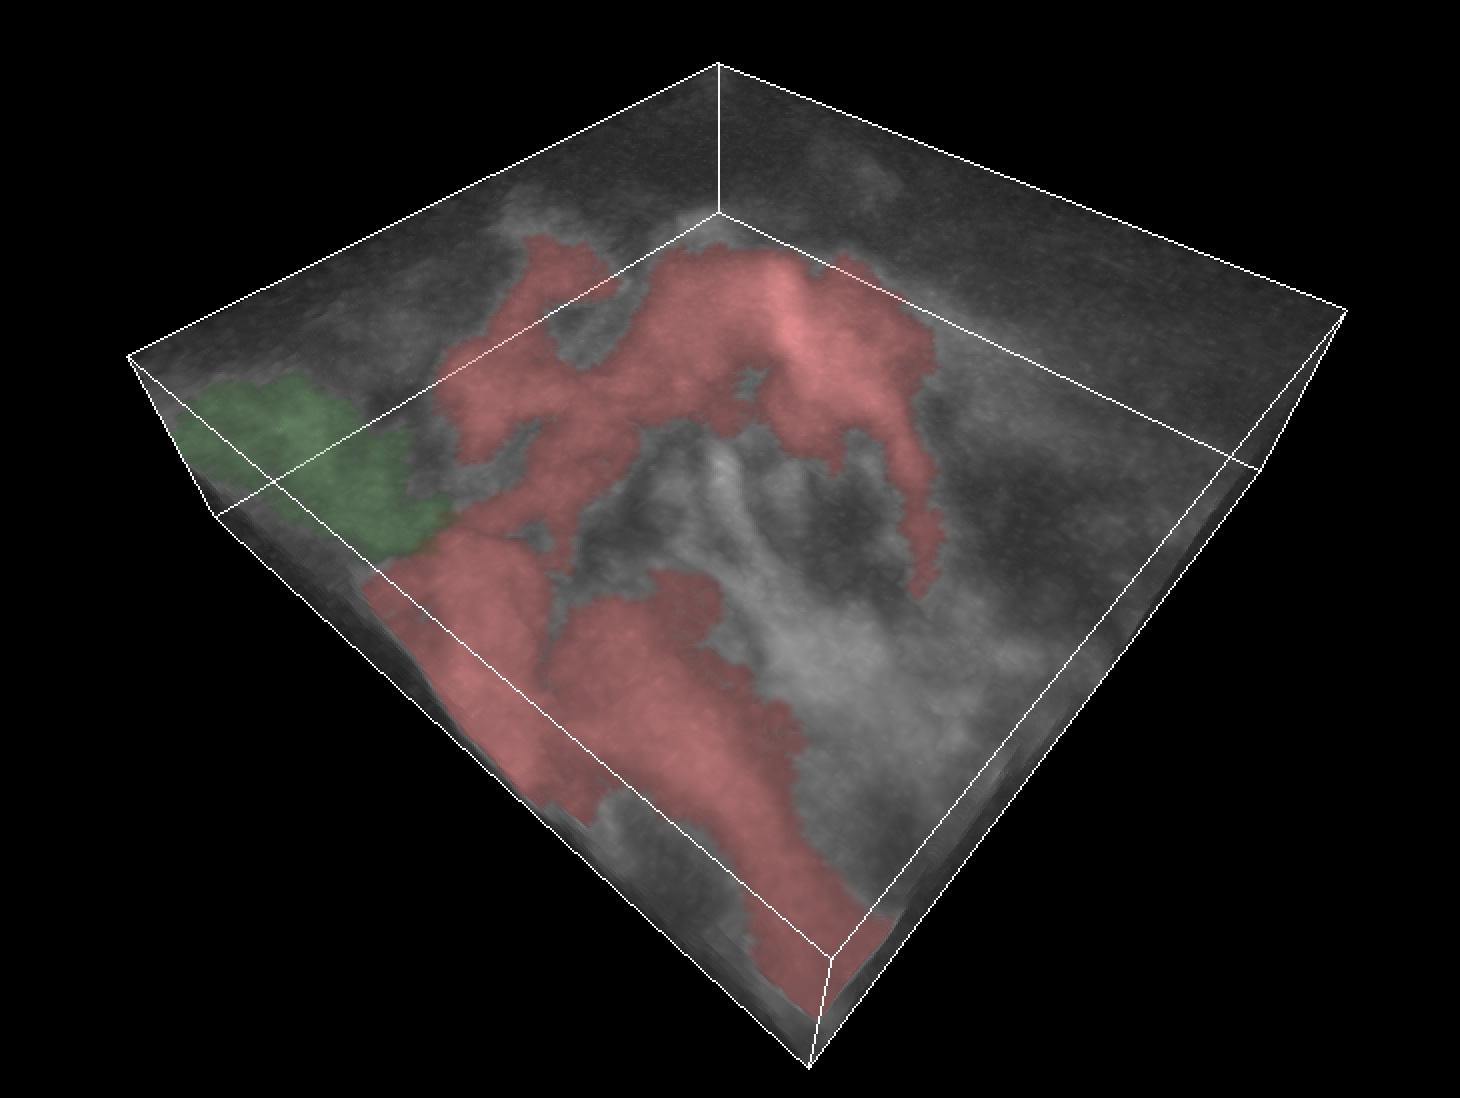
At the moment, the 3D viewer is only able to show multiple datasets if they are on the same grid. Note that for this viewer, the limits in the options panel in the bottom left are in pixel coordinates, not world coordinates.
3D Isosurface Viewer
This viewer is still highly experimental and currently very slow for displaying isosurfaces. In addition, it is only able to show a single isosurface level. We do not recommend using it at this time.
General limitations/known issues
- At the moment there are no axis labels on the white rectangular box
- At the moment, the 3D viewers show the data on a black background, as opposed to the standard Glue viewers which show the data on a white background. Therefore, the color of the data may need to be adjusted to work for both cases when using multiple viewers. In future, we plan to make it possible to choose the background color for all viewers and default to a uniform setting.
- The performance of the viewers may not yet be optimal with large datasets - if in doubt, start with a smaller dataset first to see if you will run into performance issues.
Reporting issues
Please report any issues in the following issue tracker. Please first check that there is not already a similar issue open – if there is, please feel free to comment on that issue to let us know you ran into that problem too!
Credits
- Penny Qian
- Tom Robitaille
- Maxwell Tsai